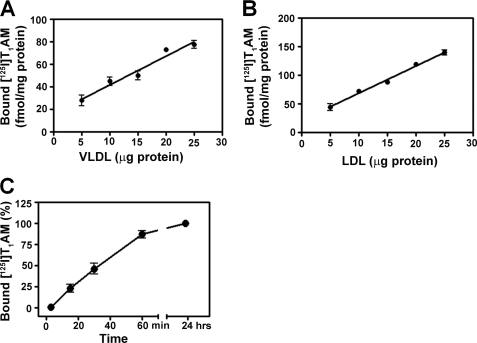
FIGURE 5.
Specific binding of [125I]T1AM as a function of VLDL concentration (A) and LDL concentration (B) is shown. Purified VLDL and LDL fractions were incubated with a tracer quantity of [125I]T1AM in the presence or absence of excess T1AM (50 μm) in 0.1 m Tris-HCl buffer for 24 h at 4 °C. C, time course of specific binding of T1AM to LDL. Each data point is the mean ± S.D. of three experiments.

