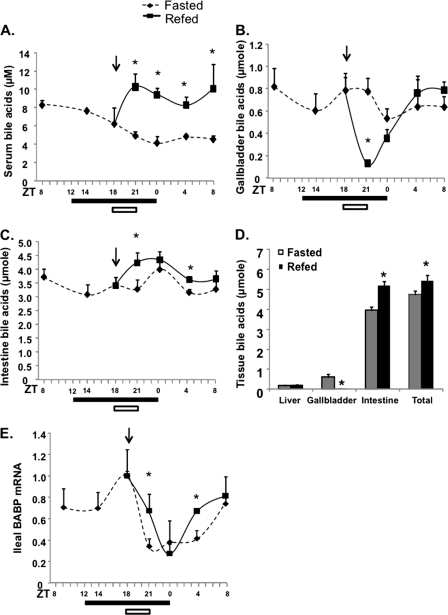
FIGURE 5.
Effects of restricted feeding on tissue and serum bile acid homeostasis. Serum bile acids (A), gallbladder bile acids (B), and intestine bile acids (C) were measured in fasted and food-restricted mice at different time points, as indicated. D, tissue bile acids were quantified in fasted and refed (3 h) mice. E, ileum bile acid-binding protein mRNA was determined by real-time PCR. A filled bar below each panel indicates the dark period. An arrow and open bar indicate the start of restricted feeding and period (3 h). Results are expressed as mean ± S.E. (error bars) (n = 4). *, statistical significance versus fasted mice at the same time point (p < 0.05).

