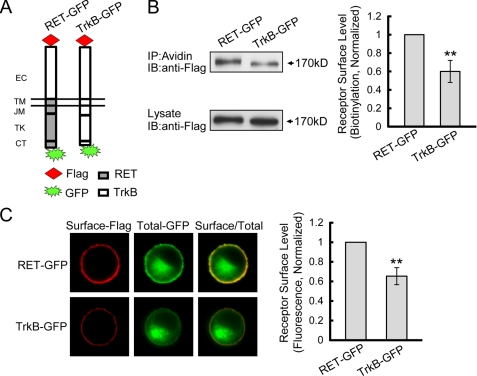
FIGURE 3.
Ratiometric fluorescence assay to measure RET and TrkB receptor surface levels. A, expression plasmids of RET and TrkB chimeras tagged with Flag epitope were constructed on the pEGFP-N1 backbone as shown. B, receptor cell surface levels were quantified by biotinylation methods in transfected PC12 cells. Immunoreactive bands were quantified by Image J software and cell surface receptor levels were represented as surface/lysate ratios. Relative receptor surface levels were normalized to that of RET-GFP. The results are represented as mean ± S.E. from three independent experiments (**, p < 0.01 versus RET surface levels; Student's t test). C, ratiometric fluorescence assay to quantify RET and TrkB receptor surface levels. PC12 cells expressing indicated receptors were stained with anti-Flag M2 antibody under unpermeabilization condition followed with Alexa Fluor 594-conjugated donkey anti-mouse IgG (red). The Alexa Fluor 594 fluorescence represented surface receptor levels, and the GFP fluorescence represented total receptor levels. Surface receptor levels were represented as the ratios of surface-Alexa Fluor 594/total-GFP fluorescence. Relative receptor surface levels were normalized to that of RET-GFP. The results are represented as mean ± S.E. from three independent experiments (**, p < 0.01 versus RET surface levels; one-way ANOVA).

