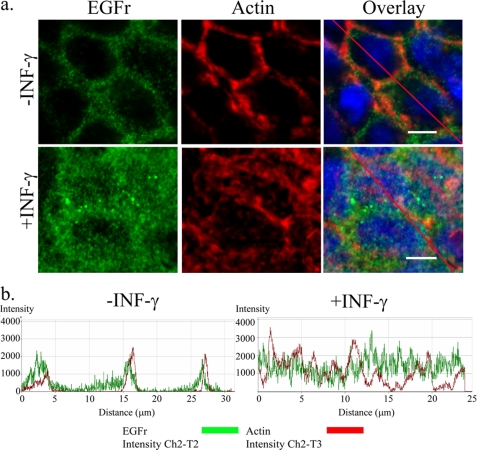
FIGURE 3.
IFN-γ pretreatment changes cellular distribution of EGFr. a, in control cells (top), EGFr (green) is colocalized to the actin cytoskeleton (red) with only sparse localization to the cytoplasm and nucleus. In IFN-γ (1000 units/ml, 72 h)-treated cells (bottom), EGFr redistributes to the cytosol, resulting in partial loss of colocalization with submembrane actin. In addition, treatment with IFN-γ increases overall EGFr expression as followed by confocal microscopy (n = 3, 3–5 visual fields, white bar = 10 μm). b, an analysis along the randomly assigned lines in a was done on the representative overlay images of both control and IFN-γ-treated cells in Fig. 4a (red line). A shift in coincident peaks of EGFr (green line) from actin (red line) was observed in cells treated with IFN-γ compared with control cells.

