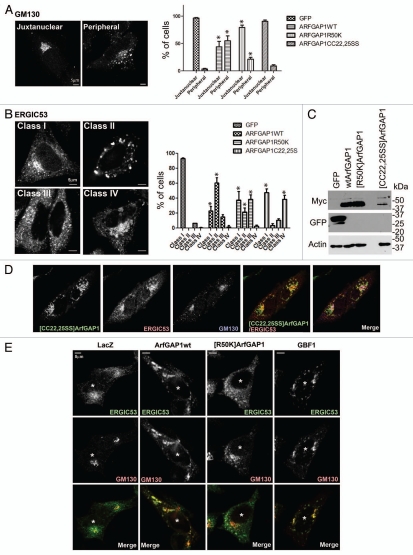
Figure 8.
Effect of overexpressed wild-type and mutant ArfGAP1 on organellar morphology. (A) Golgi. Golgi morphology was analyzed using GM130 antibody in HeLa cells. Golgi morphology was classified into 2 classes depicted in the left panel, and more than 50 randomly chosen transfected cells were classified. The data are presented in the right panel, which is the summary of 3 independent experiments. Data were analyzed by two way ANOVA followed by the Bonferoni multiple comparisons test. * indicates p < 0.05 compared with GFP controls. (B) ERGIC. ERGIC morphology, analyzed using ERGIC53 antibody in HeLa cells, was grouped into 4 classes, depicted in the left panel, and quantified as in (A). The summary of the data is presented in the right panel. Statistical analysis was performed as descript in (A). (C) Expression level of ArfGAP1 and mutants. Protein expression was examined by immunoblotting lysates of HeLa cells. Wild-type and mutant ArfGAP1 were detected by anti-myc antibody. The non-specific band is indicated by an asterisk. (D) Relative localization of Golgi and ERGIC proteins in cells expressing [CC22,25SS]ArfGAP1. Cells expressing [CC22,25SS]ArfGAP1 were stained with antibodies against myc (for [CC22,25SS]ArfGAP1), GM130 and ERGIC53. (E) Effect of GBF1 on the Golgi and ERGIC. ArfGAP1 expression affected cells similarly to cells overexpressing GBF1. HeLa cells were transfected as indicated, and the cells were triple stained with anti-myc (not shown), anti-GM130 (green), and anti-ERGIC53 (red). The transfected cells were indicated by an asterisk.

