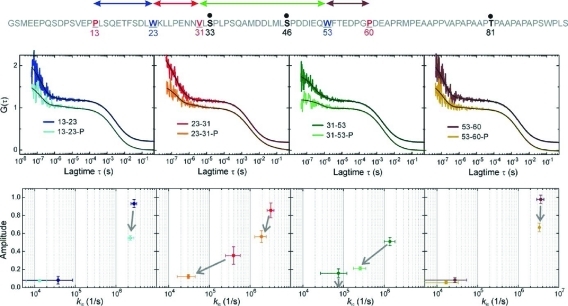
Figure 3.
Segmental chain motions in p53-TAD(1–93) and influence of phosphorylation. Top: Sequence as shown in Figure 1. The sites of enzymatic phosphorylation are indicated in bold and as black dots. Middle: Autocorrelation functions (ACFs) recorded from modified p53-TAD(1–93) with and without side chains S33, S46, and T81 phosphorylated. The probed chain segments are color-coded as illustrated in the top sequence and shown in each panel (phosphorylation is indicated as P). The black lines are data fits to a model for a single diffusing species exhibiting up to two monoexponential relaxations. ACFs of the nonphosphorylated constructs are offset along the y-axis for reasons of clarity. Bottom: Plots of the amplitudes of each of the monoexponential submillisecond decays versus the corresponding rate constant of loop closure, kic, calculated from the fitted parameters (Materials and Methods). The color code from the panels above applies. The arrows indicate the observed changes in amplitude and rate constant of the individual relaxations upon phosphorylation. An arrow to the zero-line of amplitude (x-axis) indicates the disappearance of a relaxation. Error bars are propagated standard errors from data fits.

