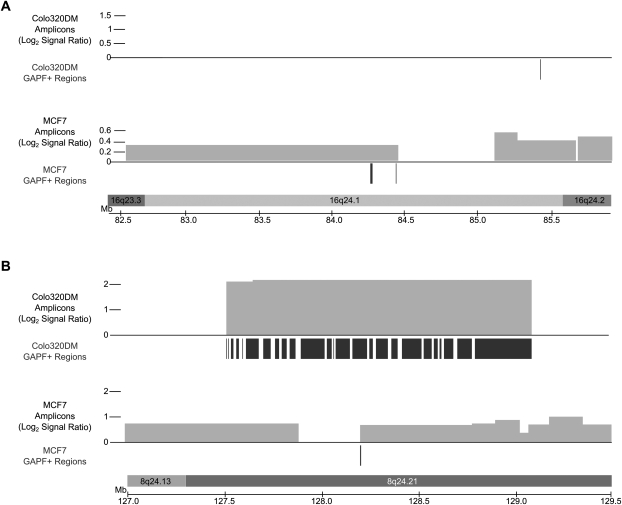
Figure 2.
GAPF-positive regions located in copy-number gains in 16q24.1 (A) and 8q24.21 (B) in Colo320DM and MCF7. Locations of GAPF-positive regions (P < 0.001, log2 signal ratio > 1.5) are denoted by the dark bars under the axes and the copy-number gains (log2 signal ratio > 0.3) by the lighter boxes above the axes, with the height of the box corresponding to the log2 signal ratio of the segment. GAPF-positive regions were determined by tiling array analysis of Colo320DM and MCF7 compared with cultured human fibroblasts. The copy-number segments were identified with SNP arrays coupled with wavelet-based statistical analysis. Regions in Colo320DM are displayed above the corresponding regions for MCF7 (as labeled). (A) The GAPF-positive regions detected in 16q24.1 in MCF7 were located in a copy-number gain, one of which was located near the boundary of the segment. In contrast, there was no amplification of 16q24.1 in Colo320DM, but one GAPF-positive region was identified. (B) The amplification in 8q24 in Colo320DM contains many GAPF-positive regions, while MCF7 has one GAPF-positive region located at a copy-number breakpoint.

