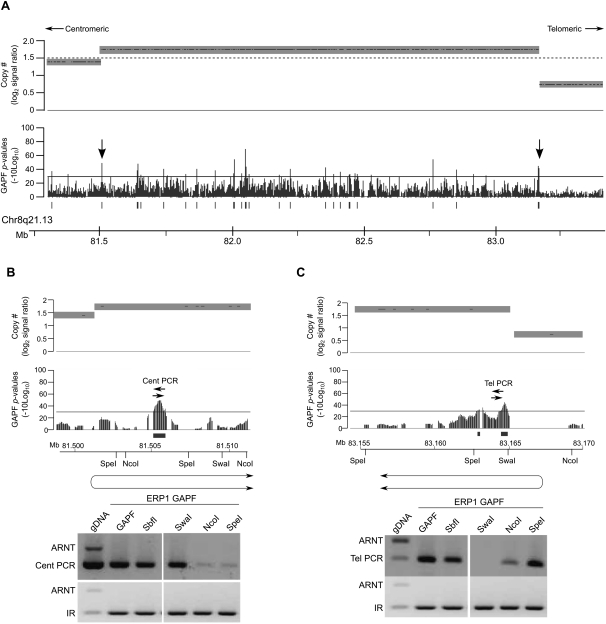
Figure 5.
Highly amplified regions in an invasive ductal carcinoma have palindromes at amplicon breakpoints. GAPF analysis on tiling arrays of the invasive ductal carcinoma (IDC) ERP1 compared with the normal, pooled PBL reference. Graphs display GAPF P-values (−10log10) and wavelet-derived copy-number segments (average log2 signal ratio). The solid bars under the graphs represent GAPF-positive regions (P-value [−10log10] > 30, run > 50 bp, gap < 100 bp). The dashed line marks where log2 signal ratio = 1.5. (A) A highly amplified region (log2 signal ratio > 1.5) in 8q21.13 in the IDC ERP1 has GAPF-positive regions located throughout the amplicon and at the breakpoints (arrows). (B,C) PCR-based enrichment analyses of GAPF-positive regions following targeted restriction-enzyme digestion prior to GAPF. Genomic DNA from ERP1 was digested with SbfI, SwaI, NcoI, or SpeI and processed by GAPF. The GAPF-positive regions at the centromeric (B) and telomeric (C) boundaries of the amplicon were assessed for enrichment over a nonpalindromic region (ARNT) using primer pairs Cent PCR and Tel PCR, respectively. A known inverted repeat (IR) was assessed to confirm enrichment of palindromic sequences by GAPF. Also assessed was ERP1 DNA not processed through GAPF (gDNA) and processed through the standard GAPF protocol (GAPF). The inferred orientations of the de novo palindromes are shown below the maps of the restriction enzymes, each placing the palindromic junction at the wavelet-derived breakpoint (P < 0.1).

