Figure 6.
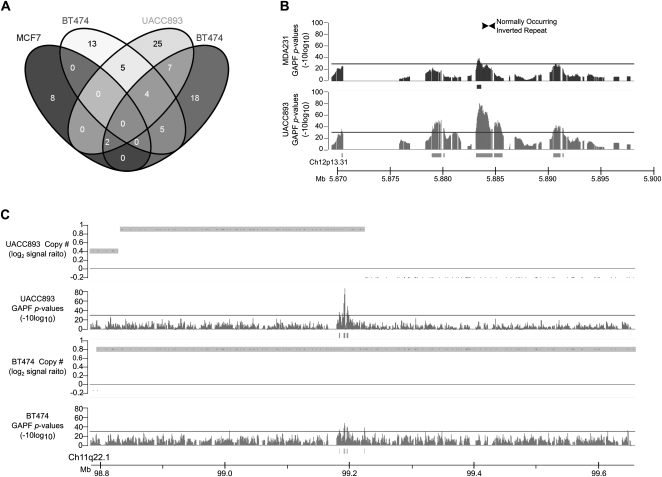
Shared GAPF-positive regions in breast cancer cell lines. (A) Venn diagram depicting the number of overlapping GAPF-positive regions (P <0.001, log2 signal ratio > 1.5) between four breast cancer cell lines MCF7, BT474, UACC893, and MDA231. (B) GAPF-positive region in 12p13 shared between UACC893 (lower graph) and MDA231 (upper graph) containing a normally occurring inverted repeat (Warburton et al. 2004). Graphs display P-values (−10log10) of GAPF analyses comparing cell lines with normal PBL reference. The solid bars under the graphs mark GAPF-positive regions (P-value [−10log10] > 30, run > 50 bp, gap < 100 bp). (C) A GAPF-positive region was present in UACC893 (upper graphs) and BT474 (lower graphs) at the same location and associated with copy-number gain. Graphs display GAPF P-values (−10log10) and wavelet-derived copy-number segments (average log2 signal ratio). Copy-number gains are defined by the shaded boxes (log2 signal ratio > 0.3).

