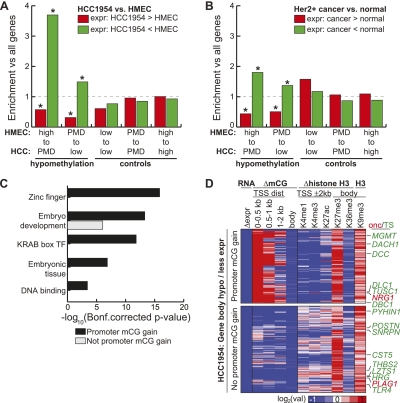
Figure 2.
Gene body hypomethylation is associated with gene repression. (A) Genes were overlapped with 10-kb domains undergoing hypomethylation (high to PMD, PMD to low) or control (low to low, PMD to PMD, high to high) transitions. Shown is the enrichment of each transition state with genes having HCC1954 expression at least eightfold more (red) or less (green) than HMEC, when compared to the global enrichment of all transition states. (*) P-value ≤ 0.01 (hypergeometric). (B) Using the same transition states in A, but comparing the expression of genes in a panel of 50 ERBB2+ (HER2+) breast cancers compared to a panel of 23 normal breast samples (Weigelt et al. 2005; Oh et al. 2006; Perreard et al. 2006; Herschkowitz et al. 2007, 2008; Hoadley et al. 2007; Mullins et al. 2007; Hennessy et al. 2009; Hu et al. 2009; Parker et al. 2009; Prat et al. 2010). Significantly more (red) or less (green) expressed genes are defined by a Wilcoxon rank sum test (P-value ≤ 0.01) between the expression values of the two different panels. (*) Enrichment P-value ≤ 0.01 (hypergeometric). (C) Functional enrichment of hypomethylated genes having loss of expression by the DAVID analysis tool (Dennis et al. 2003). (D) Epigenetic status of genes undergoing hypomethylation in gene bodies with loss of expression. With the exception of H3K9me3, all values are of HCC1954 relative to HMEC. RNA, log2 (HCC1954 RPKM/HMEC RPKM); ΔmCG, log2 (HCC1954%mCG/HMEC %mCG); Δhistone, log2 (HCC1954 ChIP/input) − log2 (HMEC ChIP/input); H3K9me3, log2 (HCC1954 ChIP/input). (Onc) oncogene, (TS) tumor suppressor.

