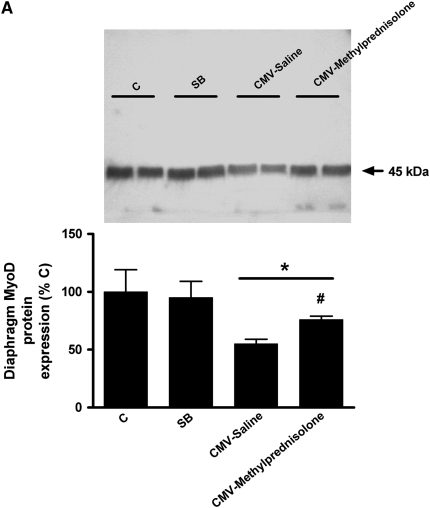
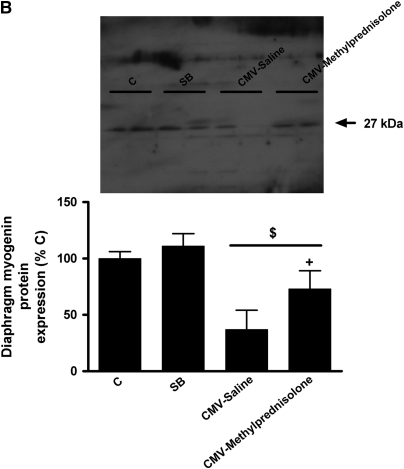
Figure 4.
Western blot densitometric analysis of (A) MyoD and (B) myogenin for control rats (C, n = 5), spontaneous breathing rats (SB, n = 5), and controlled mechanical-ventilation rats treated either with saline (CMV-Saline, n = 6) or with methylprednisolone (CMV-Methylprednisolone, n = 7). Values are means ± SD and are expressed as a percentage of C. *P < 0.05 versus C and SB, #P < 0.05 versus CMV-Saline, $ P < 0.01 versus C and SB, + P < 0.01 versus CMV-saline.


