
Figure 2.
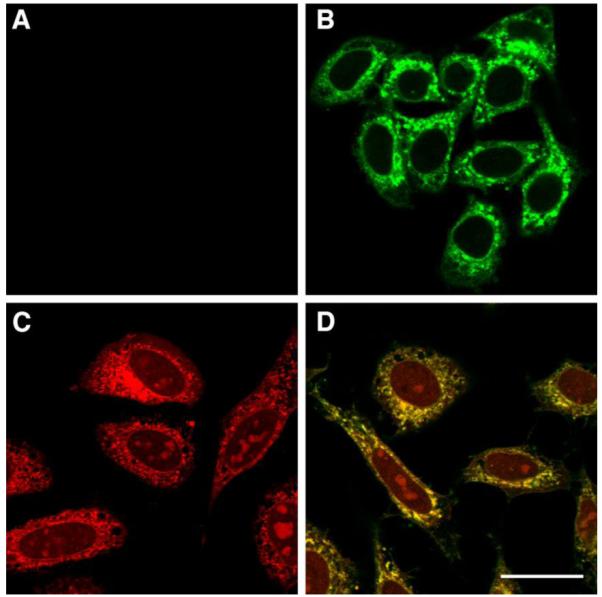
HeLa cells incubated with peptides 1 or 2 at 1 μM for 2 h. Panel A) Click reaction performed on cells that were not treated with an alkyne peptide, showing no background labeling by TAMRA-N3. Panel B) Peptide 2 visualized with green 5-Fam fluorescence. Panel C) Peptide 1 monitored by click reaction with TAMRA-N3 on fixed cells. Panel D) Peptide 2 monitored by click reaction with TAMRA-N3 on fixed cells and green 5-Fam fluorescence; the yellow color indicates co-localization of 5-Fam and TAMRA fluorophores, now present on the same peptide. The size bar represents a distance of 25 μm.