Figure 3.
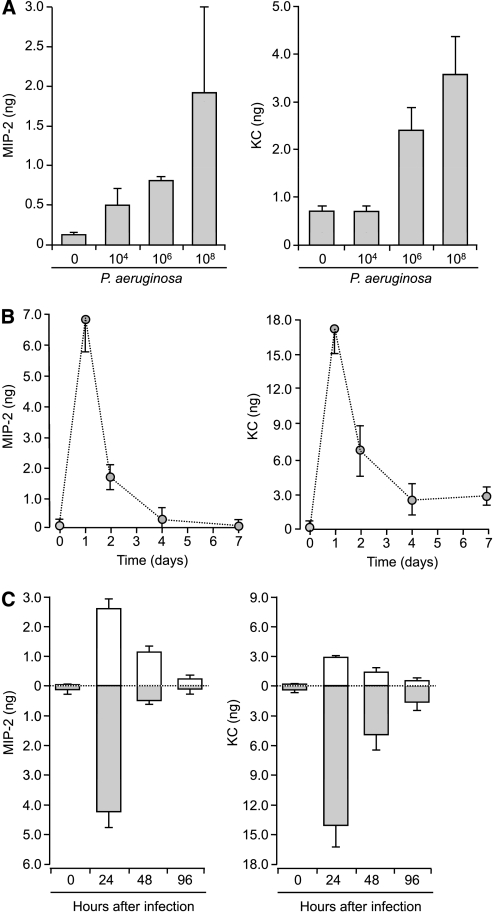
Dose–response and time course for release of CXC-chemokines from WT mTECs after infection with P. aeruginosa. (a) Release of total MIP-2 and KC from mTECs 24 hours after infection with increasing doses of P. aeruginosa PAO1 (0, 104, 106, and 108 CFU/ml, n = 5–7 Transwells). (b) Total secretion of MIP-2 and KC at different times after infection (0, 1, 2, 4, and 7 days) with P. aeruginosa (108 CFU/ml, n = 6 Transwells). Peak release of CXC-chemokines occurred 24 hours after infection and decreased over time, which paralleled mRNA expression. (c) Vectorial secretion of chemokines from WT mTECs after infection with P. aeruginosa. After stimulation of WT mTECs with 108 CFU/ml P. aeruginosa PAO1 for 1 hour, apical washings or basolateral media were collected 0, 24, 48, or 96 hours after infection, and assayed for MIP-2 and KC (n = 5 Transwells). Means ± SEM are shown. Apical and basolateral CXC-chemokine concentrations before and after stimulation differed significantly (ANOVA, P < 0.005). Open columns indicate apical secretion; shaded columns indicate basolateral secretion. Both CXC-chemokines were predominately secreted from the basolateral surface, based on comparisons at different times after infection.

