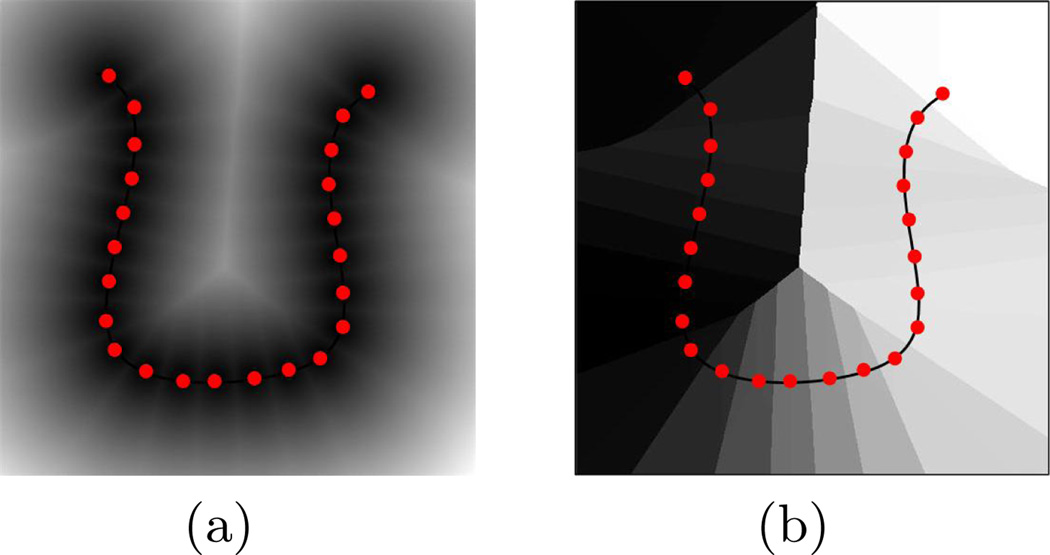
Fig. 1.
(a) Distance map from sample points on a cluster center and (b) the point correspondence label map with the center overlaid. Each region in the label map, displayed by a different color, consists of all of the points in the space that have the minimum distance to a specific point on the cluster center. Therefore, projecting any curve onto this label map determines the point correspondence of each of its samples to the center based on which region that sample is located.

