
Figure 1.
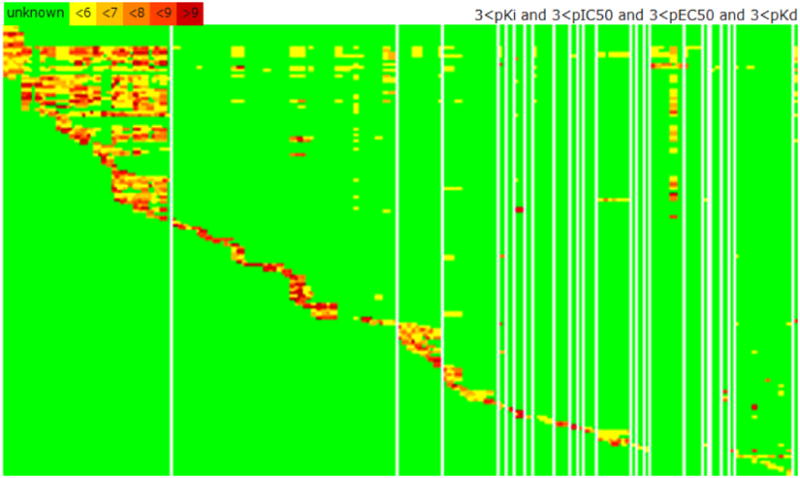
Visual summary of the IUPHAR/PDSP databases, showing 4,033 interactions for 736 drugs (rows) and 178 targets (columns). The heatmap is color coded: bioactivity is higher from yellow to dark red; green indicates absent data. Targets are clustered by family (e.g., G-protein coupled Class A amine receptors are in the far left column). The density of bioactivity in the top left corner reflects the promiscuity of this class of receptors, which includes dopaminergic, muscarinic and serotonergic receptors.