
Figure 3.
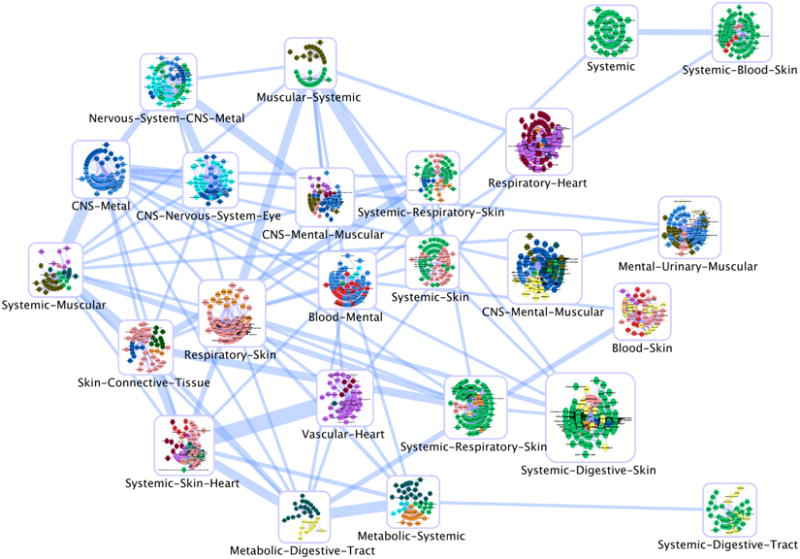
The SE-based D-T-CO network, showing the inter-dependence between drugs, targets and clinical outcomes. Color codes are as follows: Blood, red; CNS, blue; connective tissue, green; digestive tract, yellow; eye, medium purple; heart, dark red; mental, light blue; metabolic, dark cyan; muscular, olive; nervous system, cyan; respiratory, orange; skin and mucosa, pink; systemic, lime green; urinary, light yellow; vascular, magenta. Edge thickness in this network is based on the 10 dimensional PC model, where the centroids of the 25 SOM clusters was used to calculate the Euclidean distances between clusters. This was further projected on two dimensions to map the relative position among clusters