
Figure 4.
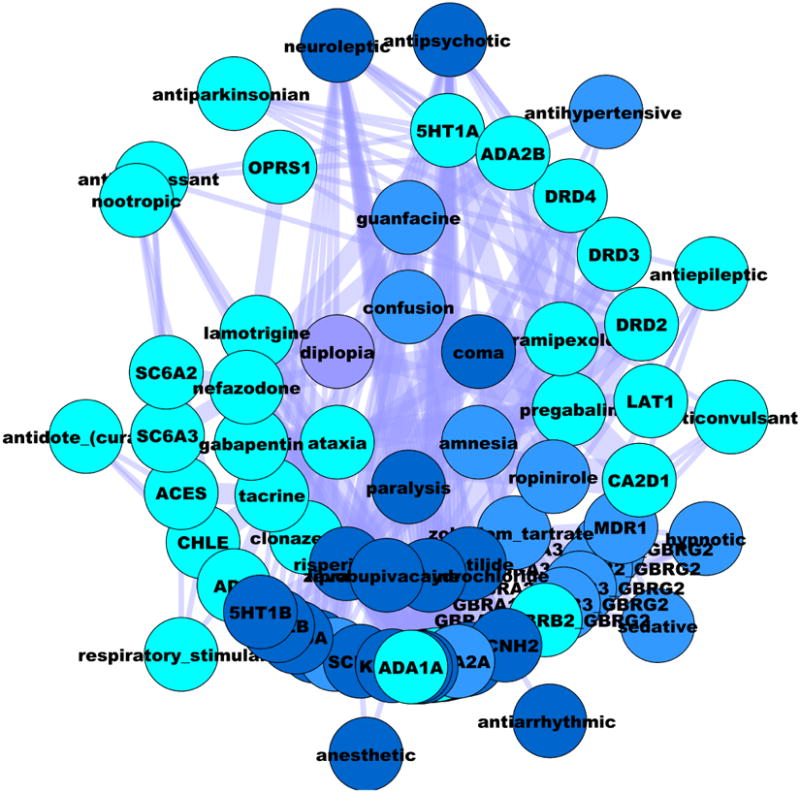
The mental-CNS-deficiency network based on SE (inner layer), the associated drugs (inner middle layer), their confirmed targets (outer middle layer), and intended clinical outcomes (outer layer). Edge thickness in this network is proportional with the strength of the DT interaction. Color codes are discussed in Figure 3.