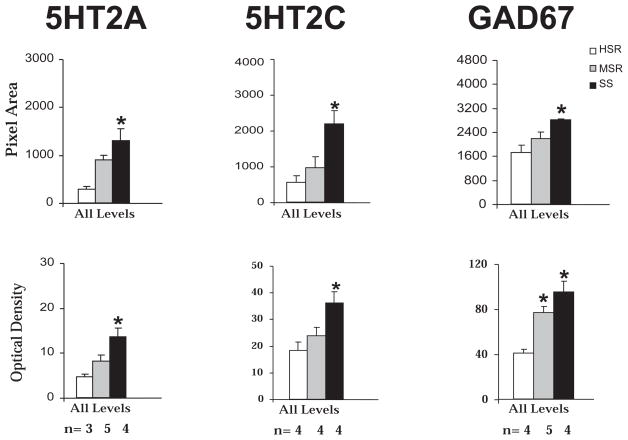
Figure 10. 5HT2A, 5HT2C and GAD67 mRNA expression in hypothalamus of HSR, MSR and SS monkeys.
Left panel. 5HT2A optical density (OD) and pixel area were obtained at 5 levels of the PVN of HSR, MSR and SS monkeys. The mean of all of the levels was obtained for each animal and then the overall mean was obtained for the group so that the SEM represents the variance between animals. There was significantly more 5HT2A mRNA in the PVN of SS animals compared to HSR animals
Middle panel. 5HT2C optical density (OD) and pixel area were obtained at 3 levels of the infundibulum of HSR, MSR and SS monkeys. The mean of all of the levels was obtained for each animal and then the overall mean was obtained for the group so that the SEM represents the variance between animals. There was significantly more 5HT2C mRNA in the infundibulum of SS animals compared to HSR animals
Right panel. GAD67 optical density (OD) and pixel area were obtained at 3 levels of the infundibulum of HSR, MSR and SS monkeys. The mean of all of the levels was obtained for each animal and then the overall mean was obtained for the group so that the SEM represents the variance between animals. There was significantly more GAD67 mRNA in the infundibulum of SS animals compared to HSR animals. *p<0.05, Kruskal-Wallis one-way ANOVA, Dunn’s posthoc test compared with HSR animals. The number of animals used in each group is shown below the histograms. Reprinted from Centeno et al., 2007a.

