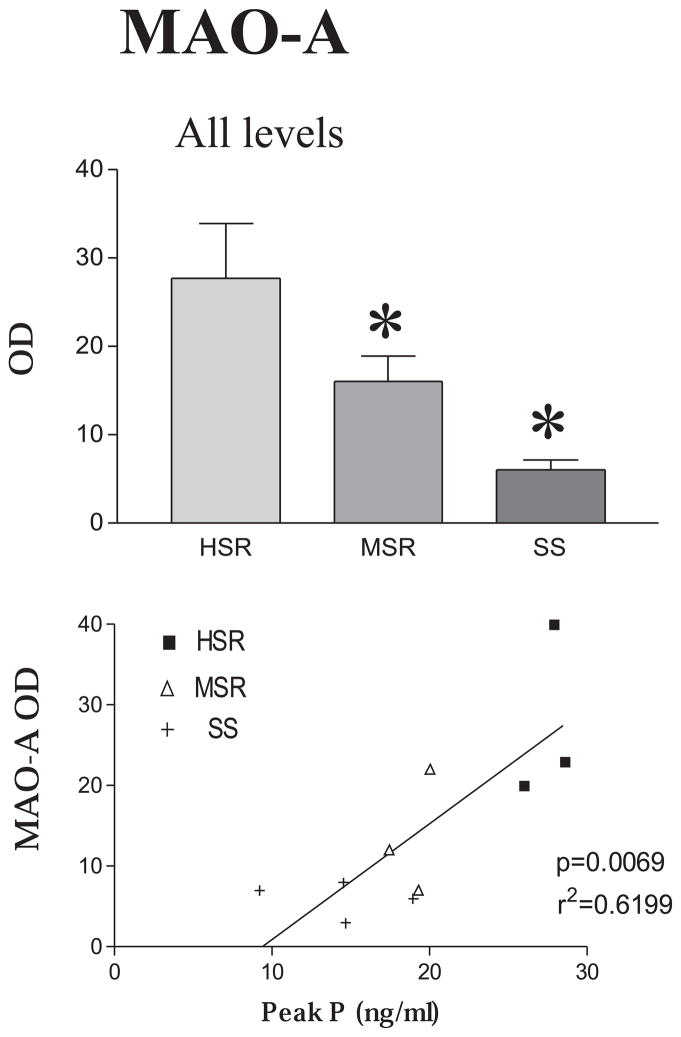
Figure 8.
Top panel The mean optical density for MAO-A mRNA signal for all 6 levels of the DRN was obtained for each animal. Then, the mean of the animals in each group was obtained so the SEM represents the variance between animals. There was a significant decrease in MAO-A signal in the medium stress resistant and stress-sensitive groups compared to the high stress resistant group (p < 0.007, ANOVA followed by Tukey’s). Bottom panel. A regression analysis was performed with the mean OD for MAO-A of each individual animal (average across 6 levels) versus the peak serum progesterone concentration of the same animal obtained 3 years earlier during a control, non-stressed menstrual cycle. There was a significant positive correlation between MAO-A mRNA OD and peak progesterone levels from a non-stressed cycle (p=0.0069). Reprinted from Bethea et al., 2005b.

