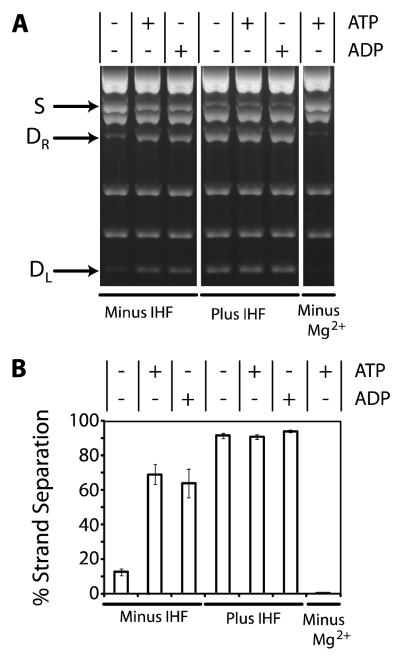
FIGURE 2. The Strand Separation Activity of λ Terminase.
Panel A The strand separation assay was performed as described in Experimental Procedures except that ATP (10 μM), ADP (10 μM), and/or IHF (50 nM) were included as indicated. The migration of the nicked, annealed substrate (S) and the strand separation products (DR and DL) in the agarose gel are indicated with arrows. Panel B. Quantitation of the data presented in Panel A. Each bar represents the average of at least three separate experiments with standard deviations indicated.

