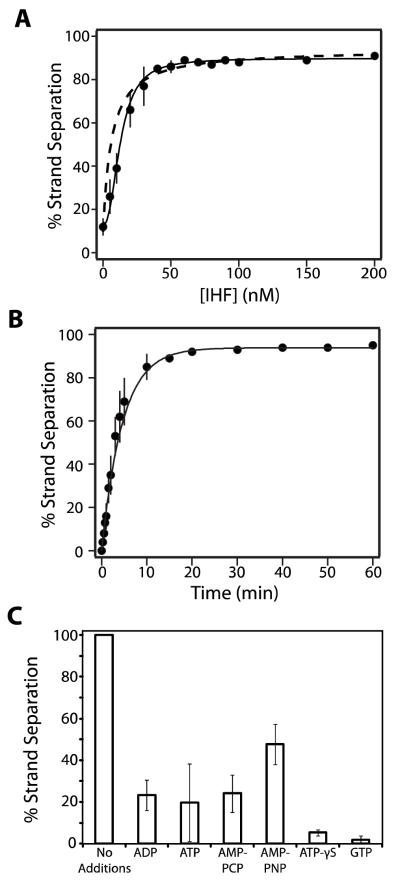
FIGURE 5. IHF Stimulates Strand Separation Activity in the Absence of Nucleotides.
Panel A. The strand separation assay was performed as described except that nucleotide was omitted and the indicated concentration of IHF was included in the reaction mixture. Each data point represents the average of at least three separate experiments with standard deviation indicated with a bar. The dashed line represents the best fit of the data to a simple binary IHF-DNA binding model (equation 2). The solid line represents the best fit of the data to a cooperative (Hill) binding model (equation 3). Panel B. The strand separation assay was performed in the absence of nucleotide and the presence of 50 nM IHF for the indicated time. Each data point represents the average of at least three separate experiments with standard deviation indicated with a bar. The solid lines represent the best fit of the data to equation 1. Panel C. The strand separation assay was performed in the absence of nucleotide and in the presence of 50 nM IHF. Additional nucleotides were added to a final concentration of 5 mM as indicated. Each bar represents the average of at least three separate experiments with standard deviation indicated.

