Figure 4.
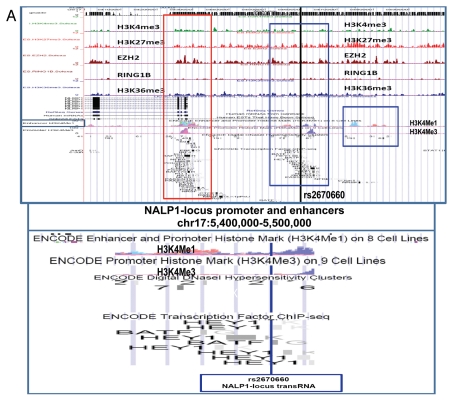
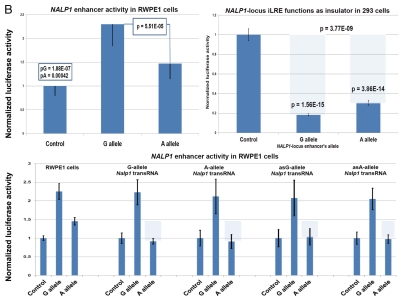
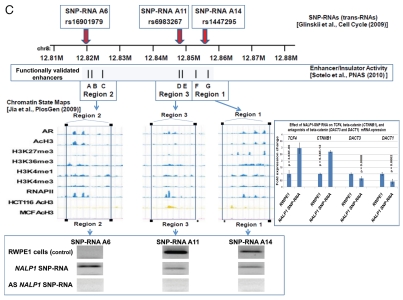
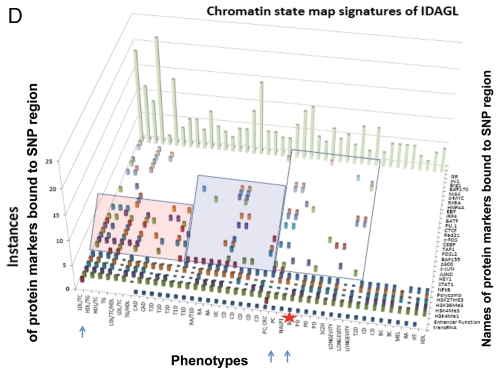
Identification and characterization of genomic trans-regulatory domains (GTRDs) that are located in intergenic disease-associated genetic loci (IDAGL), manifest enhancer/insulator activities and transcribe biologically active snpRNAs. Examples of the chromatin state map analysis of the intergenic disease-associated genomic region transcribing NLRP1-locus snpRNA rs2670660. Boxed areas depict the locations of the NLRP1 promoter (red box) and two intergenic enhancers (blue boxes), one of which is characterized in this study and shown at higher resolution in the bottom figure. Positions of disease-linked SNP nucleotides within snpRNA-encoding sequences are indicated by vertical lines. Chromatin state maps of individual snpRNA-encoding genomic sequences in human embryonic stem cells are visualized using the custom tracks of the UCSC Genome Browser (genome.ucsc.edu/ENCODE/). Color-coded horizontal lines depict alignments of DNA sequences derived from Chip-Seq experiments using antibodies against corresponding proteins. Individual zoom-in chromatin state maps aligned to corresponding snpRNA-encoding sequences are shown with the corresponding disease-linked SNPs (Figs. S2–4). Original experiments describing the corresponding mouse and human genome-wide chromatin state maps were reported in reference 20. Luciferase reported assay reveals allele-specific enhancer/insulator activities of the 2 kb intergenic DNA sequence containing distinct allelic variants of the rs2670660 NLRP1-locus SNP. Luciferase reporter assay to assess the enhancer activity of 2 kb NLRP1-locus intergenic region was performed in RWPE1 (set of bars in left top part) and HEK293 set of (set of bars in the right top part) cells transiently expressing either control luciferase reporter plasmids or plasmids containing chemically synthesized 2 kb sequences flanking distinct allelic variants of the NLRP1-locus integenic SNP rs2670660, which is positioned exactly in the middle of the enhancer's sequence. Note decreased enhancer's and insulator's activities in ancestral A allele constructs compared with pathology-linked G allele constructs. Bottom parts of bars show the effects of NLRP1-locus snpRNAs on enhancer and insulator activities in RWPE1 cells. Note that distinct alleles of the NLRP1-locus intergenic enhancer manifest different responses to the NLRP1-locus snpRNAs and enhancer's activities in ancestral A allele constructs are completely blocked compared with pathology-linked G allele constructs. Molecular anatomy of the network of intergenic long-range enhancers (iLRE s) and snpRNAs facilitating castration-resistant phenotype of human prostate cancer. NLRP1-locus snpRNAs, which are transcribed from the intergenic long-range enhancer sequence located in the 17p13 region at ∼30 kb distance from the NLRP1 gene, regulate expression level of 8q24-locus PC susceptibility snpRNAs (bottom gel images and Fig. 2), which are transcribed from intergenic enhancers located in the prostate cancer susceptibility regions 1, 2 and 3 (middle). Activity of the iLRE containing PCS SNP rs6983267 is increased 15–20-fold by the co-transfection of β-catenin/TCF4 transcription factors, expression of which is significantly elevated in RWPE1 cells engineered to constitutively express NLRP1-locus snpRNAs (sets of bars in inset). In contrast, expression of antagonists of β-catenin, DACT3 and DACT1 is decreased in NLRP1-locus snpRNA-expressing cells. References to the original publications reporting chromatin state maps, activity of intergenic enhancers and identification of trans-regualtory snpRNAs of the 8q24 prostate cancer susceptibility regions 1, 2 and 3 are indicated and discussed in the main text. Graphical representations of the reported in Table S10 and Figure S4 chromatin state maps of 43 IDAGLs. Areas highlighted in red and blue indicate disease type-specific transcription factor signatures that appear associated with sets of pathogenetically- and/or epidemiologically related disorders. Each column represents the individual IDAGL containing an SNP associated with a particular trait or disease phenotype. Each row corresponds to the individual chromatin state marker protein. The last row shows a cumulative chromatin state score indicating how many proteins were bound in close proximity of the corresponding SNPs. Visualization tools and links to original experimental data are publicly available (http://genome.ucsc.edu/ENCODE/). Arrows indicate functionally validated enhancers. Star indicates NLRP1-locus enhancer.


