Figure 6.
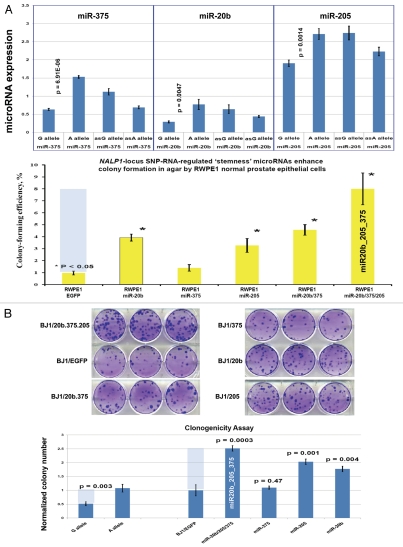
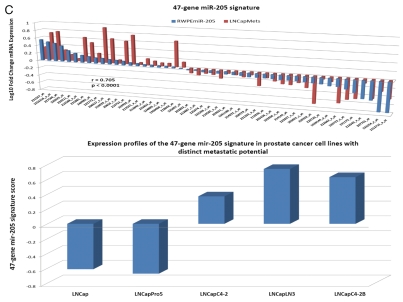
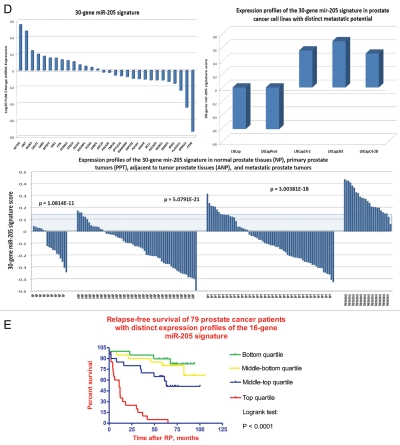
Regulatory crosstalk between NLRP1-locus snpRNAs, 8q24-locus PCS-snpRNAs and snpRNA-regulated microRNAs induces similar clinically relevant phenotypes in human cells. (A) Q-PCR analysis of microRNA expression in human cells engineered to constitutively express NLRP1-locus snpRNAs identifies concordant SNP allele-sequence-specific changes of expression levels of three microRNAs, miR-375, miR-20b, miR-205, expression of which increased in human embryonic stem cells and blood-borne human prostate carcinoma metastasis precursor cells (Fig. S10). Human cell lines engineered to constitutively express NLRP1-locus snpRNAs manifest altered expression profiles of PCS-snpRNAs (Fig. 2; induced PCS-snpRNAs are marked with red arrows) and expression levels of three stemness microRNA (miR-375, miR-20b, miR-205). Human cells engineered to constitutively express NLRP1-locus snpRNA-regulated stemness microRNAs (miR-375, miR-20b, miR-205) manifest dramatic changes of anchorage-independent growth in agar [RWPE1 cells; (A, bottom part)] and clonogenic growth potential in clonogenicity assays [BJ1 cells; (B)]. These microRNA-induced phenotypic changes recapitulate phenotypes of human cells engineered to constitutively express NLRP1-locus snpRNAs and PCS-snpRNAs (Figs. 1, 2 and S9 and ref. 4). Microarray expression profiling experiments identify a set of 47 transcripts manifesting highly concordant expression profiles (r = 0.705; p < 0.0001) in RWPE1 human prostate epithelial cells engineered to stably express either microRNA miR-205 or NLRP1-locus snpRNAs in blood-borne human prostate carcinoma metastasis precursor cells of PC3 lineage and in highly metastatic variants (LNCapLN3; LNCap-C4-2; LNCap-C4-2B) of LNCap lineage (C). Microarray analysis reveals activation of snpRNAs/miR-205 axis in human prostate cancer. (D) Refinement of the 47-transcript signature to yield individual Pearson correlation coefficients > 0.5 in highly metastatic cell lines and < −0.6 in parental and less metastatic variant LNCapPro5 (top sets of bars) generates the 30-gene expression signature, which signifies highly concordant expression profiles in clinical samples of distant metastatic lesions (bottom sets of bars) compared with normal prostate samples (p = 1.1E-11), histologically normal prostate tissue samples adjacent to tumors (p = 5.1E-21) and primary prostate tumors (p = 3.0E-18). Multivariate Cox regression analysis of the 30 genes comprising the miR-205 signature identifies a highly significant 16-gene therapy failure prediction model (Chi Square = 47.1919; p = 0.0001); Kaplan-Meyer analysis of clinical samples from 79 prostate cancer patients with known clinical outcomes after radical prostatectomy39,41 using weighted survival prediction algorithm39 demonstrates that patients with distinct expression profiles of the 16-gene miR-205 signature have statistically distinct probability of therapy failure [Log rank test: Chi Square = 64.67; p < 0.0001; (E)]. Note that all patients (100%) in the top quartile failed therapy; in contrast, only 16% of patients in the bottom quartile failed therapy within 5 y after radical prostatectomy.


