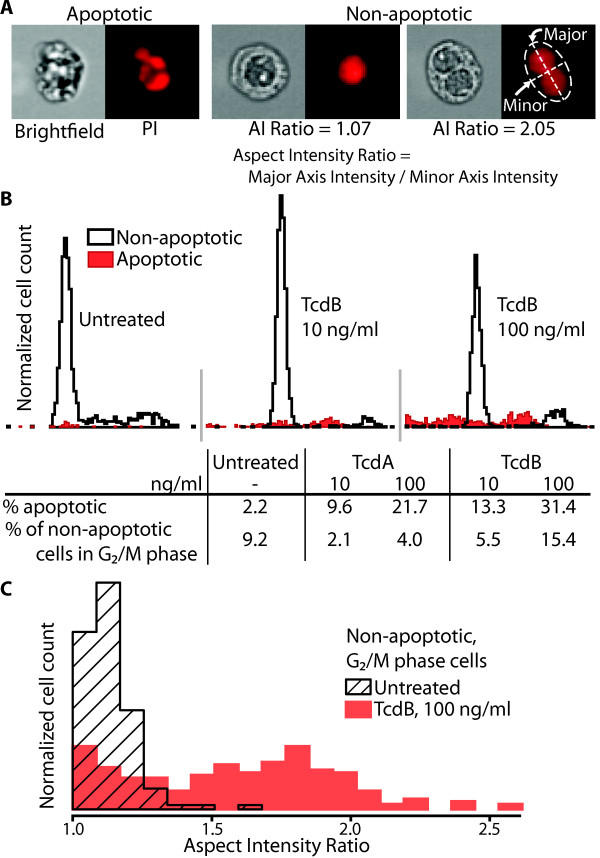
Figure 4.
Distribution of apoptotic versus non-apoptotic cells within the cell cycle and characteristics of G2/M phase, toxin-treated cells. A. Cells were classified as either apoptotic or non-apoptotic based on the contrast of their brightfield image and the area of PI fluorescence. Representative images of a cell in each class are shown (100 ng/ml TcdB). B. Histograms of the area of PI fluorescence of each cell show the location of apoptotic and non-apoptotic cells within the cell cycle. The percentage of G2/M cells represents the proportion of non-apoptotic cells with a G2/M level of DNA. C. Non-apoptotic G2/M phase cells were analyzed to determine the number of distinct nuclei. For this analysis only, cells with an area of PI fluorescence 1.85 times greater than the PI fluorescence area at the G0/G1 peak were considered to be G2/M cells. The major and minor axis intensity values are the length of the axis weighted by the intensity of the image along the axis.

