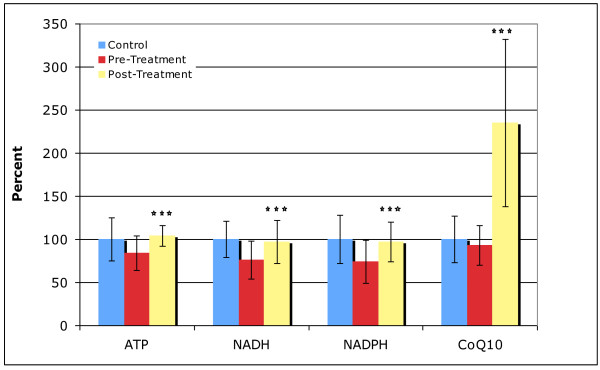
Figure 5.
Level of biomarkers in controls and in the Arizona autism treatment group (pre and post), normalized to the level in the neurotypical controls. The average values and the standard deviations are shown. The number of asterisks indicates the p-value for the t-test of the change in the biomarker from pre-treatment to post-treatment in the autism group (* p < 0.05, ** p < 0.01, *** p < 0.001).

