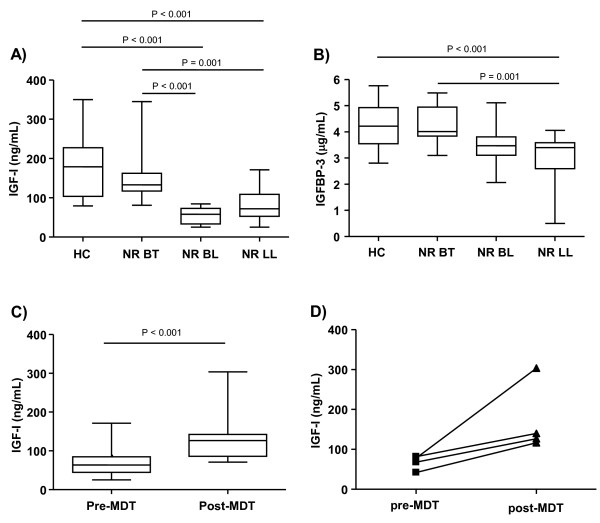
Figure 1.
Serum IGF-I and IGFBP-3 levels along the spectrum of leprosy clinical forms. Box-plots represent the serum levels of IGF-I (a) and IGFBP-3 (b) assessed in healthy controls (HC) and nonreactional borderline tuberculoid patients (NR BT), borderline lepromatous leprosy patients (NR BL), and lepromatous leprosy patients (NR LL) prior to MDT. (c) Serum levels of IGF-I of NR BL/LL patients pre-MDT and post-MDT. Median values are indicated by lines (-). Statistical differences between the groups were evaluated by ANOVA, using age as a covariate. (d) Represent the circulating levels of IGF-I in paired pre- and post-MDT serum samples from the same patient. Each line represents one patient.

