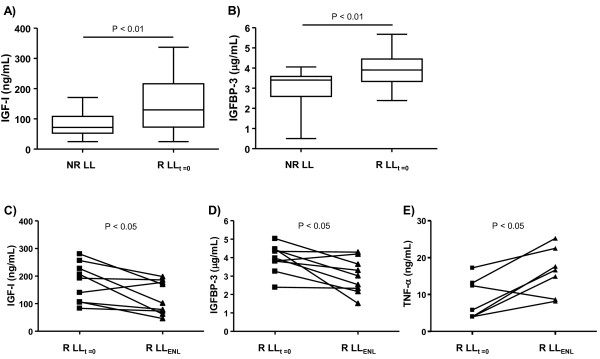
Figure 2.
Circulating IGF-I and IGFBP-3 levels change according to disease status in LL patients. Box-plots represent the serum levels of IGF-I (a) and IGFBP-3 (b) assessed in nonreactional (NR LL) and reactional LL (R LLt = 0) patients at the pre-MDT stage. Median values are indicated by lines (-). (c), (d) and (e) represent the serum levels of IGF-I, IGFBP-3, and TNF-α, respectively, at the pre-MDT stage and during ENL (R LLENL). Each line represents one patient. Paired t test was used for statistical analysis.

