
Figure 4.
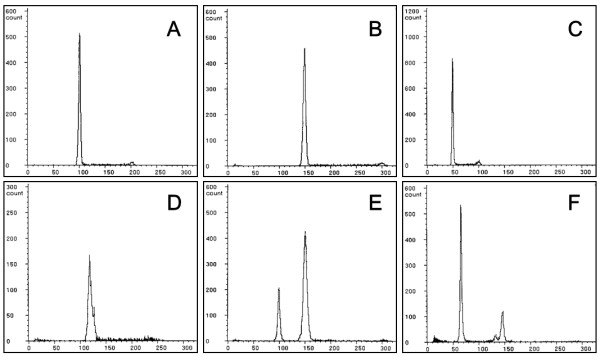
Relative DNA contents of fry developing from the control and cold-shocked groups. A: Wild-type diploid of the control group; B: Wild-type triploid from the 0°C cold-shocked group; C: Albino haploid from the 0°C cold-shocked group; D: Hyper diploid showing wild-type phenotype from the 0°C cold-shocked group; E: Euploid mosaic (diploid and triploid) with wild-type phenotype from the 6°C cold-shocked group; F: Aneuploid mosaic (1.3n-2.9n) with wild-type phenotype from the 9°C cold-shocked group.