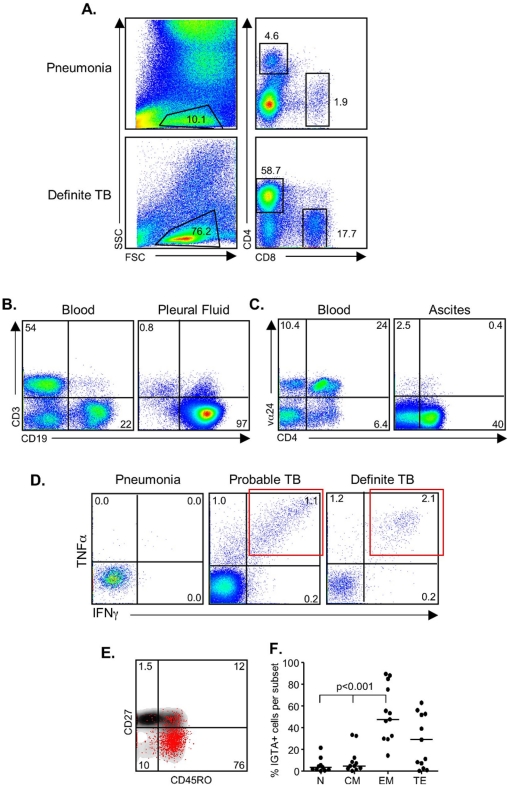
Figure 1. Flow cytometry comparison between peripheral blood and pleural fluid.
(a) Ex vivo assessment of the cell phenotypes within the pleural fluid. Shown are representative flow cytometry profiles from a patient with pneumonia and one who was diagnosed with TB. Profiles are first gated on the lymphocyte population as determined by FSC and SSC. Following singlet and CD3 gating, analysis of CD4+ and CD8+ T cell populations is performed. (b) Analysis of a subject with pleural effusion caused by malignancy. In this case CD3 and CD19 are plotted together to illustrate T and B cell proportions in the blood (left) and pleural fluid (right) of a subject with a malignancy (subject 33). (c) Flow cytometry profile from blood and ascites where the blood had a distinct Vα24+CD4+ T cell population; absent from the ascites. (d) Functional analysis of PF cells. Overnight stimulation of PF cells with PPD was followed by intracellular cytokine detection. Following gating on the CD4+ T cells, TNF-α and IFN-γ positive cells were assessed. There was no response from the patient with a bacterial infection but a striking response from the patients with definite and probable TB. In particular, note the presence of a distinct IFN-γ+TNF-α+ double-positive cell population (IGTA; red box). (e) The CD4+ IGTA population was gated and the naïve/memory phenotype determined by CD27 and CD45RO expression (red-dot overlay). (f) Analysis of 12 subjects with evaluable data was performed using a Kruskal-Wallis test followed by Dunn's post-test comparison. We found the majority of the IGTA+ cells were of an effector memory phenotype (EM; CD27−CD45RO+), bottom right quadrant of (d). N = naïve (CD27+CD45RO−); CM = central memory (CD27+CD45RO+); EM = effector memory (CD27−CD45RO+) and TE = terminal effectors (CD27−CD45RO−).

