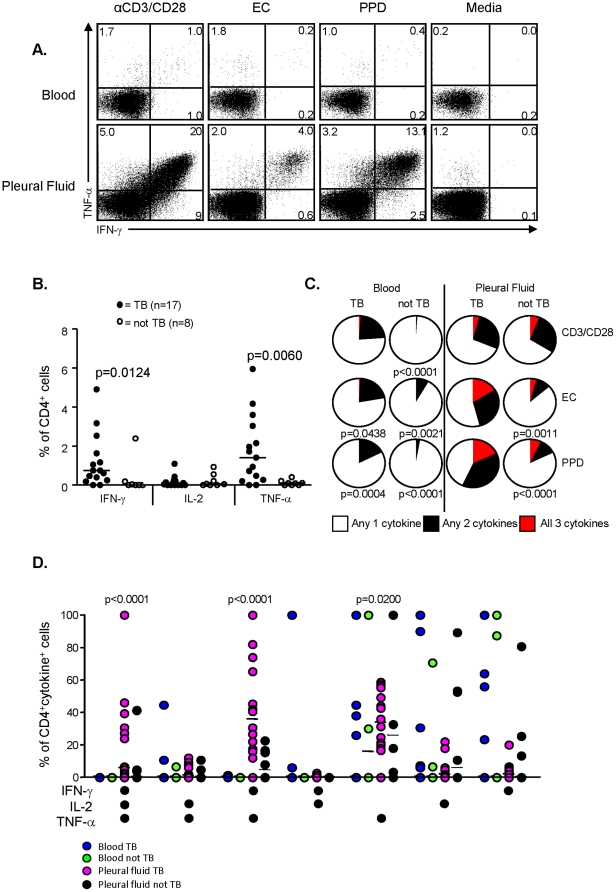
Figure 2. Quantitative and qualitative analysis of PPD-specific T cell responses.
(a) Qualitative IFN-γ and TNF-α responses following overnight antigen stimulation of peripheral blood or pleural fluid cells. Shown are representative flow cytometry profiles from a patient with definite TB following overnight stimulation with anti-CD3/CD28 (positive control), ESAT-6/CFP-10 fusion protein (EC), PPD or unstimulated (media alone). (b) Quantitative assessment of IFN-γ, IL-2 and TNF-α secreting CD4+ T cells in subjects with TB and those without. Shown are the proportions of CD4+ T cells in the PF secreting IFN-γ, IL-2 or TNF-α in response to overnight stimulation with PPD. Statistical analysis was performed using a Mann-Whitney U test and p-values<0.05 were considered statistically significant (indicated). (c) Relative levels of polyfunctional T cell responses in subjects with TB or without. Shown are pie graphs demonstrating the proportion of cytokine-positive CD4+ T cells that produced only 1 of the cytokines (white), any 2 of the cytokines (black) or all 3 cytokines (red) from blood or pleural fluid of subjects with or without TB following anti-CD3/CD28, EC or PPD stimulation overnight. Statistical analysis of overall variance was performed using in-built SPICE software (ANOVA) and p-values indicate significantly decreased polyfunctionality compared to cells from the pleural fluid of subjects with TB. (d) Analysis of the functional profile of PPD-specific CD4+ T cells on the basis of simultaneous production of IFN-γ, IL-2 and TNF-α. All possible combinations of the 3 cytokines are shown along the y-axis. Statistical analysis was performed using a Mann-Whitney U- test and p-values are indicated (Pleural fluid TB significantly different to all 3 other groups).

