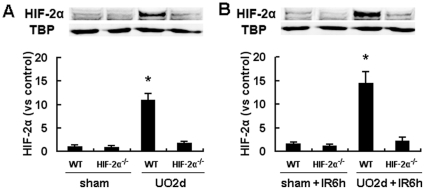
Figure 3. HIF-2α levels in HIF-2α−/− and WT mouse kidneys.
A, HIF-2α−/− mice or their wild-type littermates were exposed to left UO, which continued for 24 hours, and then was released. 2 days after release of UO or at the corresponding time point in the non-UO sham-operated mice, the left kidneys were harvested and subjected to immunoblot analyses of HIF-2α and co-detection of TBP as a loading control. B, Mice were also exposed to I/R procedures before the harvest of the left kidneys to evaluate the HIF-2α levels 6 hours after the initiation of reperfusion. HIF-2α protein bands were quantified and normalized to TBP. There were 4 mice in each group and data were expressed as mean ± SD. The mean value obtained from sham-operated WT mice was arbitrarily defined as 1. *, p<0.05 versus all the other 3 groups.

