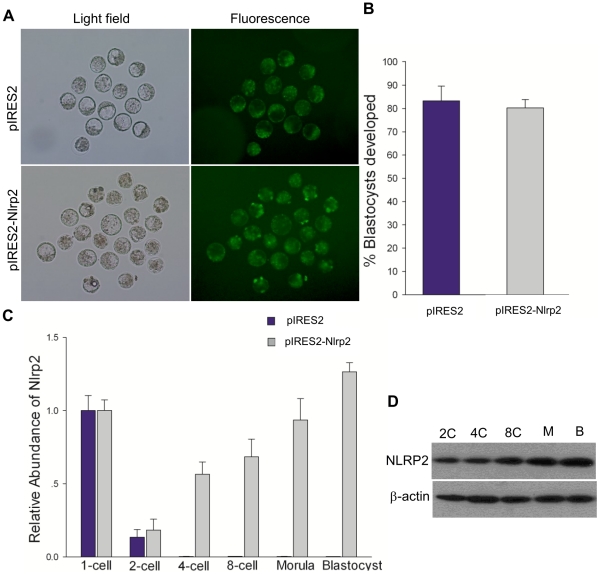
Figure 11. Overexpression of Nlrp2 in zygotes.
(A) Representative micrographs of blastocysts developing from zygotes that had been microinjected with pIRES2 or pIRES2-Nlrp2. Fluorescence images show the expression of GFP. The original magnification was ×100. (B) The blastocyst formation rate of zygotes microinjected with pIRES2 or pIRES2-Nlrp2. (C) The relative abundance of Nlrp2 transcripts after microinjection. (D) Immunoblots of mouse embryos at different stages after microinjection.

