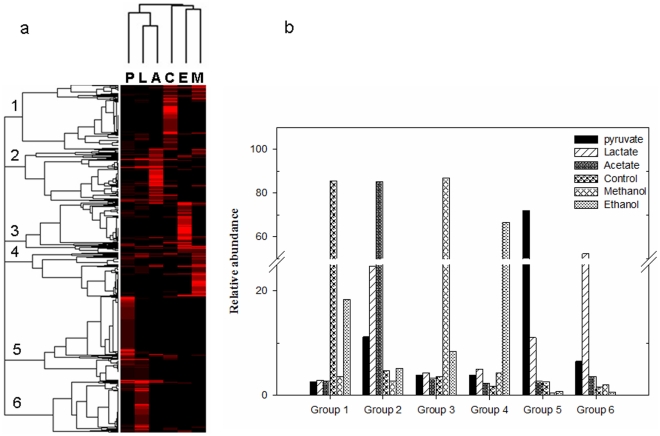
Figure 1. Hierarchical clustering analysis for microbial community profiles of the tested enriched microcosms based on all OTUs detected by barcoded pyrosequencing.
The OTUs were defined with 3% dissimilarity. The figure was generated using Cluster and visualized in Treeview. The color scale indicates relative abundances. Six samples were clearly separated into two groups and six OTU patterns were observed and indicated by numbers in the tree (a), and also illustrated in the graphs (b). The abbreviations were represent the control microcosm without electron donor amendment (C), or enriched with methanol (M), ethanol (E), acetate (A), lactate (L), or pyruvate (P).

