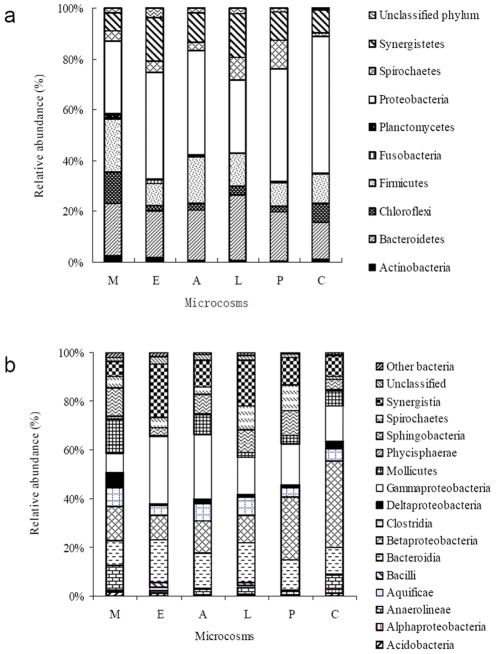
Figure 2. The predominant bacterial phyla (a) and classes (b) whose relative abundance were higher than 1.0% at least in one of the microcosms.
The abbreviations were represent the control microcosm without electron donor amendment (C), or enriched with methanol (M), ethanol (E), acetate (A), lactate (L), or pyruvate (P).

