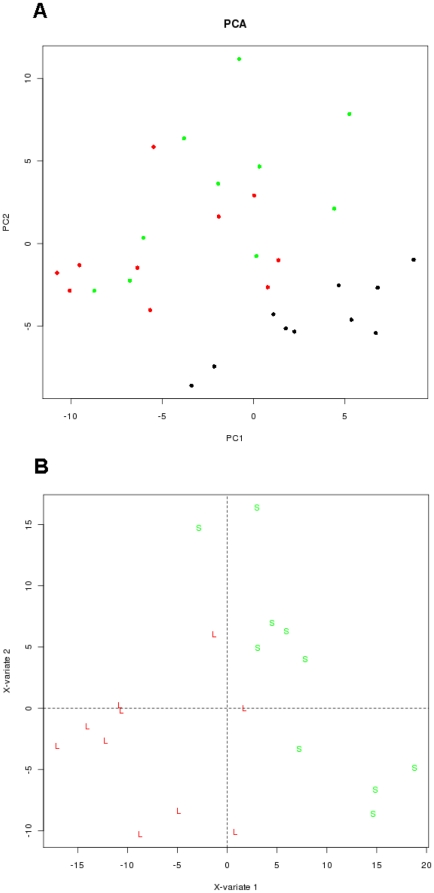
Figure 2. Principal component analysis (PCA) and partial least square analysis (PLS) on different NSCLC patient samples.
(A) Two-dimensional PCA of miRs, derived from 20 patients with NSCLC and 10 tissue samples from normal lung tissue, showing separation of the two sample groups. (B) The plot depicts components 1 and 2 of PLS model which used survival time as a scoring criteria. The analysis clearly separates the tissue sample groups for short and long survival NSCLC patients. All samples are colour coded according to group: Black: Normal patient samples; green: Samples from patients with short survival; red: Samples from patients with long survival.

