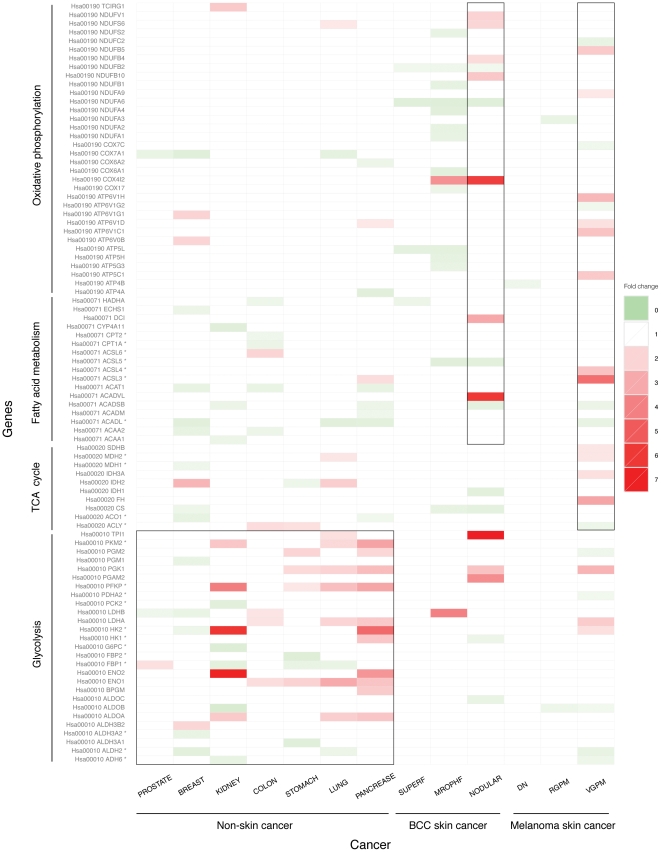
Figure 1. Expression level changes of genes involved in the four types of energy metabolism for two skin cancer types and seven non-skin cancer types.
Each row represents expression changes of a gene across all the cancer types under study. Rate limiting enzymes in each pathway are indicated using *. Each column represents one cancer type. The fold change of gene expression is color-coded with red, white and green for up-, no and down-regulation.

