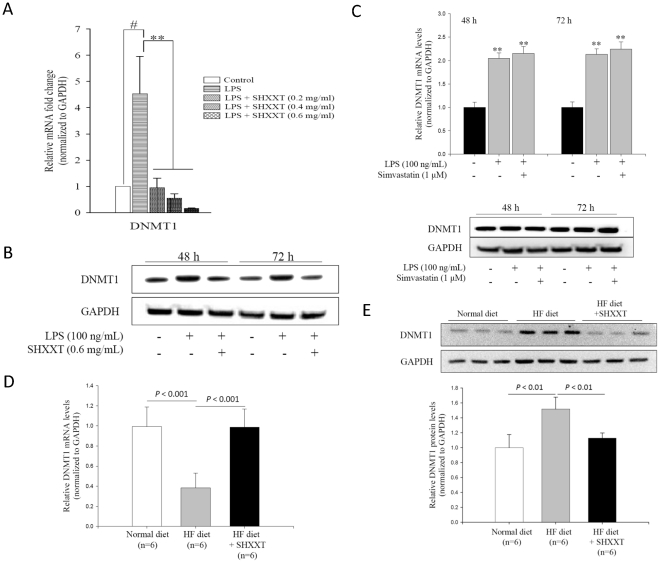
Figure 3. DNMT1 expression in LPS-induced HASMCs and the aorta of the rats under a high fat diet.
(A) HASMCs were treated with LPS (100 ng/mL) and SHXXT (0.2–0.6 mg/ml) for 48 h. DNMT1 mRNA expression were examined by real-time quantitative PCR and normalized to RU6B. (B) DNMT1 protein in LPS-treated HASMCs measured by Western blot at 48 h and 72 h. (C) DNMT1 mRNA and protein level after the treatment of simvastatin for 48 h and 72 h. ** P<0.01 versus the control group. Data represents mean ± SD from 3 independent experiments performed in triplicates. (D and E) The mRNA expression and protein level of DNMT1 of the rat aorta under a normal diet and a high-fat diet with or without SHXXT (30 mg/kg/day) for 12 weeks. The upper panel of Figure 3E shows the western blotting data and lower panel shows the quantification of western blotting. The number of SD rat in each group is 6. # P<0.05 versus control, ** P<0.01 versus LPS group. Data represents mean ± SD.

