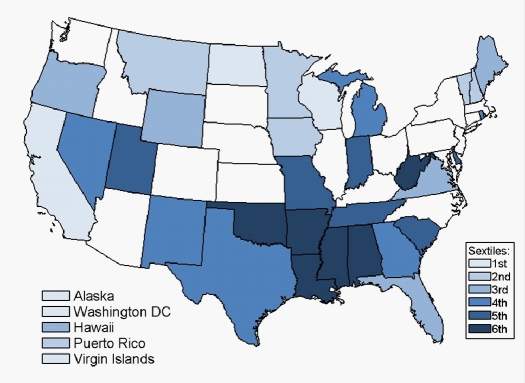
Figure 2.
Graphical representation of prevalence rates for Daytime Fatigue by state
Inset boxes for Alaska, Hawaii, Puerto Rico, U.S. Virgin Islands and Washington DC, which do not otherwise appear on the map. Colors denote sextile, which are reported in Table S4. Higher sextile numbers (darker shade) denote higher prevalence rates. States that appear in white (i.e., unshaded) did not collect Daytime Fatigue data.

