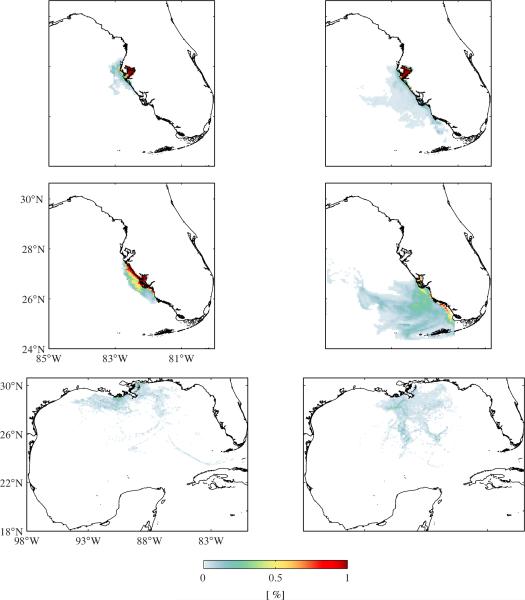
Fig. 7.
Particle concentration (expressed as percentage of total particles) maps during conditions of maximal onshore (left panels) and offshore (right panels) of the CSTB on the WFS. These maps were constructed using particles released every other day over the course of 30 d in each of the aforementioned conditions over the whole period 2000–2007 on the surface layer in Tampa Bay (top panels), Charlotte Bay (middle panels), and the vicinity of the Mississippi River's mouth (bottom panels).

