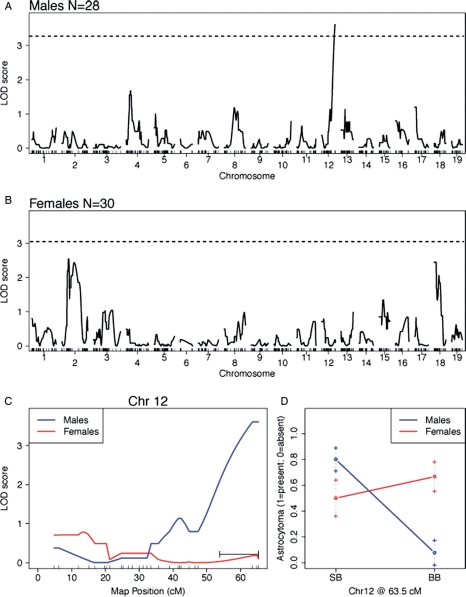
Fig. 2.
Linkage analysis for astrocytoma resistance in B6X(B6X129)-NPcis males and females. A graph of the genome-wide linkage analysis LOD scores for males is shown in (A) and for females in (B). The dotted line indicates the 0.05 alpha thresholds for statistical significance using permutation testing. (C) Linkage analysis of Chr 12 for both males (blue) and females (red). (D) The effect size of Arlm1B6/129 (SB) and Arlm1B6/B6 (BB) at 63.5 cM for males and females.

