FIG. 5.
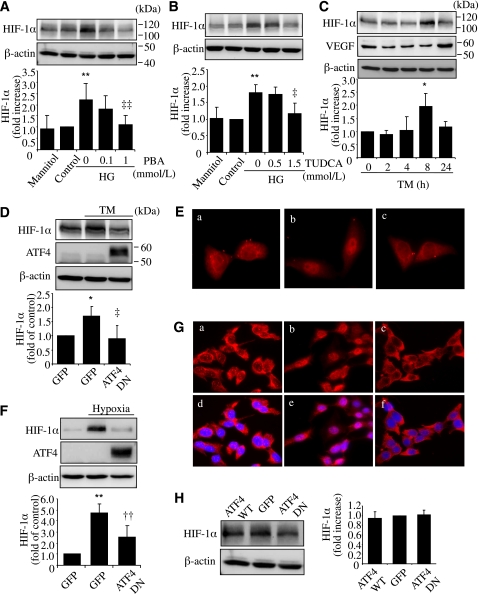
ER stress and ATF4 are required for HG- or hypoxia-induced HIF-1α accumulation in rMC-1 cells. A and B: rMC-1 cells were treated with HG with or without chemical chaperone PBA or TUDCA for 72 h. Mannitol was used for osmotic control. Protein level of HIF-1α was measured by Western blot analysis and quantified by densitometry. **P < 0.01 vs. control. ‡P < 0.05, ‡‡P < 0.01 vs. HG. C: rMC-1 cells were treated with 0.5 μg/mL TM for 2, 4, 8, or 24 h. Protein level of HIF-1α and VEGF was determined by Western blot analysis and quantified by densitometry. *P < 0.05 vs. control. D and E: rMC-1 cells were transfected with Ad-ATF4DN or Ad-GFP for 24 h followed by treatment with 0.5 μg/mL TM for 8 h. Expression of HIF-1α (D) was determined by Western blot analysis and quantified by densitometry. *P < 0.05 vs. GFP, ‡P < 0.05 vs. GFP+TM. Cellular distribution of HIF-1α (E) was examined by immunocytochemistry. a, Ad-GFP; b, Ad-GFP+TM; c, Ad-ATF4DN+TM. F and G: After infection with Ad-ATF4DN or Ad-GFP, rMC-1 cells were exposed to hypoxia for 2 h. Expression of HIF-1α (F) was determined by Western blot analysis and quantified by densitometry. **P < 0.01 vs. GFP, ††P < 0.01 vs. GFP+hypoxia. Immunostaining of HIF-1α (G) showing hypoxia-induced nuclear translocation of HIF-1α in Ad-GFP–treated cells but not in Ad-ATF4DN–treated cells. a–c, HIF-1α staining; d–f, merged images of HIF-1α (red) and nuclear staining with DAPI (blue). a and d, Ad-GFP; b and c, Ad-GFP plus hypoxia; c and f, Ad-ATF4DN plus hypoxia. H: rMC-1 cells were infected with Ad-ATF4WT, Ad-ATF4DN, or Ad-GFP for 24 h. Expression of HIF-1α was determined by Western blot analysis and quantified by densitometry (mean ± SD, n = 3). (A high-quality digital representation of this figure is available in the online issue.)

