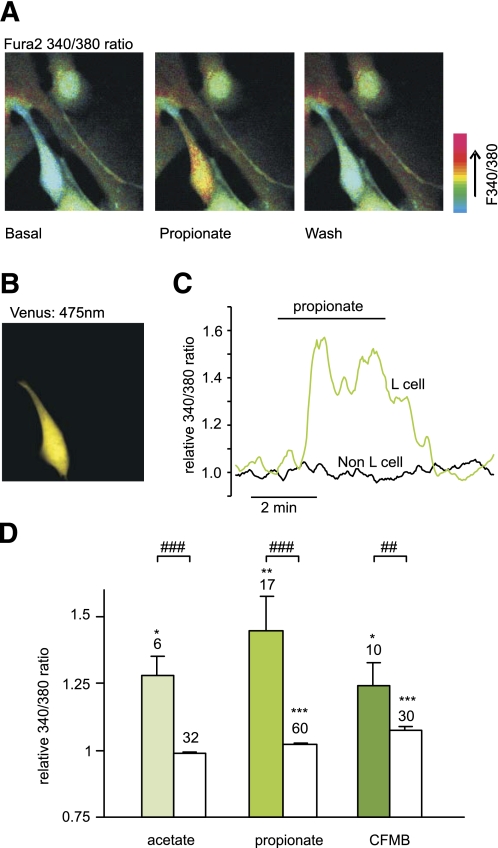
FIG. 2.
SCFAs raise intracellular calcium in identified colonic L cells. A: Mixed colonic cultures were loaded with fura2-AM. Pseudocolor images of fura2 340:380 nm fluorescence ratio (reflecting [Ca2+]i) shown prior to (basal) and during the application of propionate (1 mmol/L), and after washing with saline. B: Identification of an L cell in the field of view shown in A identified by the fluorescence of Venus (475 nm excitation). C: A representative response of an L and a non–L cell recorded as in A. D: Mean calcium changes in L cells (filled bars) and non–L cells (open bars) after the addition of acetate (1 mmol/L), propionate (1 mmol/L), or CFMB (30 μmol/L) as indicated. Ratios (340:380) in the presence of the test agent were normalized to the mean of the background ratios of each cell measured before addition and after washout of the test compound. Data represent the means ± SEM of the number of cells indicated above each bar. *P < 0.05, **P < 0.01, and ***P < 0.001 compared with baseline and ##P < 0.01 and ###P < 0.001 compared with non–L cells by Student t test. (A high-quality digital representation of this figure is available in the online issue.)

