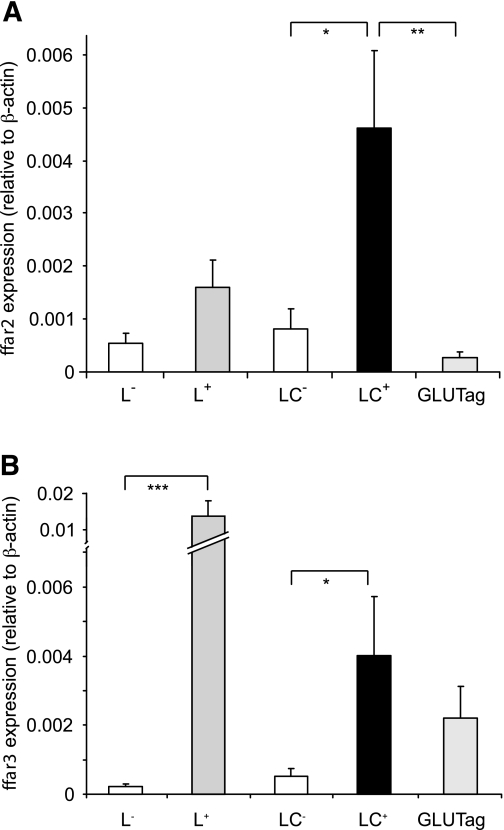
FIG. 3.
SCFA receptors FFAR2 and FFAR3 are expressed in L cells. Relative expression of ffar2 (A) and ffar3 (B) mRNAs relative to β-actin assessed by RT-PCR in FACS-sorted L cells and non–L cells from the small intestine (L+ and L−, respectively) and colon (LC+ and LC−) and the GLUTag model L-cell line. Data are presented as geometric means ± the upper SEM calculated from the log(base 2) data (n = 3 each). Significance comparisons between L cells and non–L cells were calculated by one-way ANOVA with a post hoc Bonferroni correction test performed on the log(base 2) data: *P < 0.05, **P < 0.01, and ***P < 0.001.

