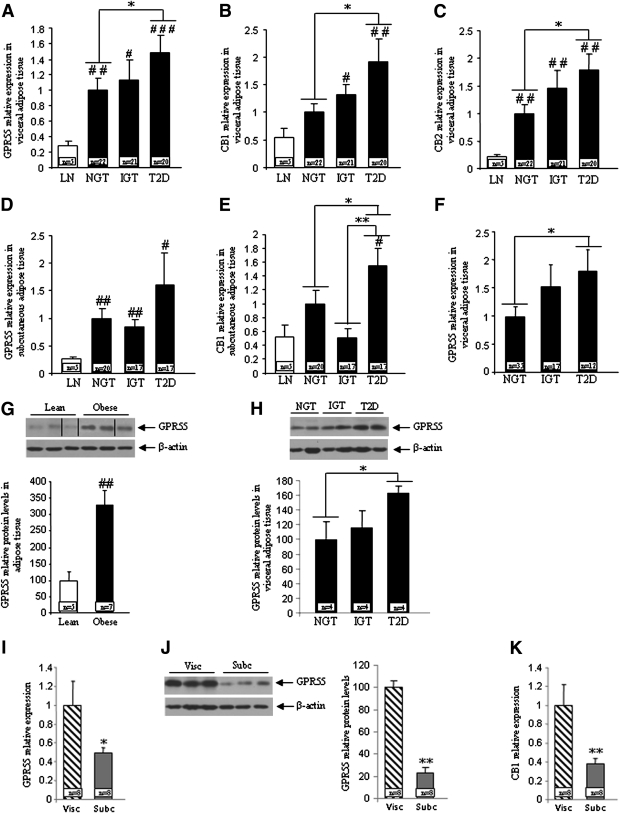
FIG. 1.
mRNA expression of GPR55 (A), CB1 (B), and CB2 (C) in VAT obtained from lean and obese subjects in cohort 1. mRNA expression of GPR55 (D) and CB1 (E) in SAT obtained from lean and obese subjects in cohort 1. mRNA expression of GPR55 (F) in VAT obtained from lean and obese subjects in cohort 2. Protein levels of GPR55 (G) in VAT obtained from lean and obese subjects in cohort 2. Dividing lines indicate splicings in the figure. Levels of GPR55 in the three different groups of obese patients (H). mRNA expression of GPR55 in the visceral and subcutaneous fat from the same obese patients (I). Protein levels of GPR55 in the visceral and subcutaneous fat from the same obese patients (J). mRNA expression of CB1 in the visceral and subcutaneous fat from the same obese patients (K). Obese subjects were subclassified as NGT, IGT, and type 2 diabetic. The relative amounts of mRNA were normalized to the value of NGT. T2D, type 2 diabetes; Visc, visceral; Subc, subcutaneous. #P < 0.05, ##P < 0.01, ###P < 0.001 vs. lean subjects; *P < 0.05, **P < 0.01 vs. NGT.

