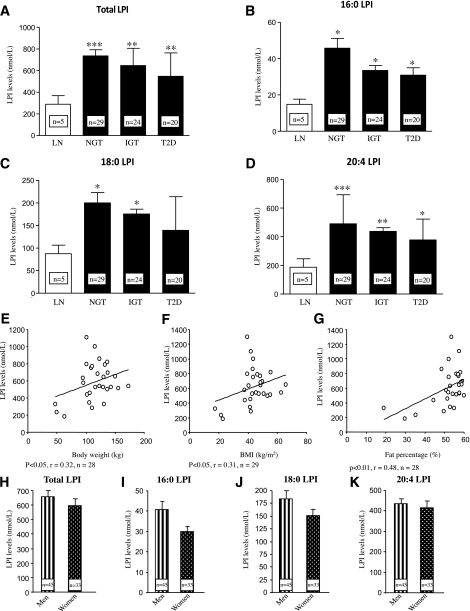
FIG. 3.
Circulating levels of total LPI (A), 16:0 LPI (B), 18:0 LPI (C), and 20:4 LPI (D) in the plasma obtained from lean and obese subjects in cohort 1. Correlation between circulating levels (plasma obtained from a subset of individuals from cohort 1) of total LPI and body weight (E), BMI (F), and fat percentage (G) in women. Circulating levels of total LPI (H), 16:0 LPI (I), 18:0 LPI (J), and 20:4 LPI (K) in the plasma obtained from men and women in cohort 1. LN, lean; T2D, type 2 diabetes. *P < 0.05, **P < 0.01, ***P < 0.001.

