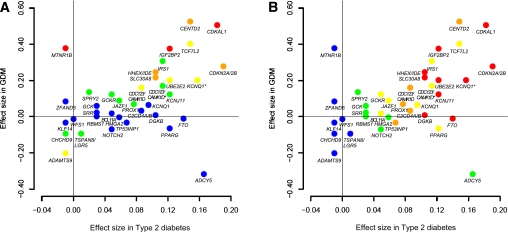
FIG. 4.
Comparison of the effect size of known type 2 diabetes variants in GDM and type 2 diabetes. Effect size (β-coefficient from logistic regression analysis) of the known type 2 diabetes variants in GDM (y-axis) and type 2 diabetes (x-axis) are plotted with their corresponding P values (A: P values in GDM; B: P values in type 2 diabetes): red, P < 0.0001; orange, 0.0001 ≤ P < 0.01; yellow, 0.01 ≤ P < 0.10; green, 0.10 ≤ P < 0.50; blue, 0.50 ≤ P. The β-coefficient for GDM was derived from our stage 1 genome scan and that for type 2 diabetes was derived from the AGEN type 2 diabetes study (26). The two CDC123/CAMK1D variants are distinguished by CDC123/CAMK1D for rs10906115 and CDC123/CAMK1D* for rs12779790. The two KCNQ1 variants are distinguished by KCNQ1 for rs231362 and KCNQ* for rs2237892. (A high-quality color representation of this figure is available in the online issue.)

