FIG. 3.
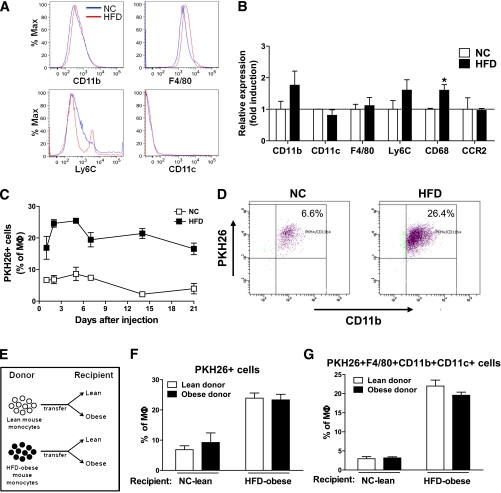
Quantitation of monocyte migration in lean and obese mice. A: Comparison of indicated monocyte markers in blood monocytes obtained from normal chow (NC)/lean and HFD-fed/obese mice. This was a representative plot for each marker from three independent experiments. n = ~5–6 in each group. B: Relative mRNA levels for indicating genes in the monocytes from an NC/lean and HFD-fed/obese mouse, as measured by quantitative PCR. Data are expressed as the mean ± SEM of three independent experiments in triplicate. *P < 0.05. n = 5 per group. C: Time course of appearance of injected monocytes as ATMs in recipient NC/lean or HFD-fed/obese recipient mice. Data present the mean ± SEM of three mice for each time point from three independent experiments. D: Two days after labeled monocyte injection into lean vs. obese mice, PKH26+ cells were calculated from total F4/80+CD11b+ ATMs by FACS analysis and then plotted with CD11b+ fluorescence. The scattergram is representative of five to six independent mice from each group. E: Donor mice were lean or obese, and labeled cells were injected into lean or obese recipients. After injection, PKH26+-labeled monocytes (F) and PKH26+F4/80+CD11b+CD11c+ cells (G) were tracked and plotted as the percentage of total macrophages in adipose tissue. The results were analyzed by a FACS and then plotted as the mean ± SEM from more than three independent experiments. n = 6 in each group.

