FIG. 5.
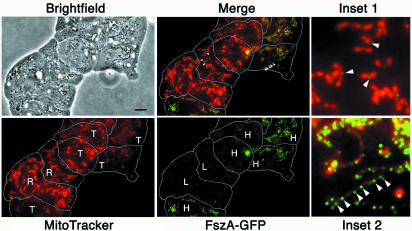
At low expression levels, FszA-GFP partially complemented the loss of FszA in ΔfszA cells. A phase-contrast, bright-field image of several closely packed and flattened ΔfszA amoebae transformed with FszA-GFP is shown, and the outlines of the cells have been traced in white. Colabeling with MitoTracker Red showed that individual amoebae contained rod (R)- or tubule (T)- shaped mitochondria. The level of FszA-GFP expression, ascertained by intensity of GFP fluorescence, was high (H) or low (L). Provided FszA-GFP was expressed at low levels in ΔfszA cells, the fusion protein reduced the percentage of cells with tubular mitochondria by increasing the proportion of rods (Merge; Inset 1). FszA-GFP localized to the midpoints of mitochondria that may have been undergoing fission (Inset 1, arrowheads). When overexpressed, FszA-GFP (Inset 2, arrowheads) appeared to be unable to reduce mitochondrial tubule formation. Scale bar = 5 μm.

