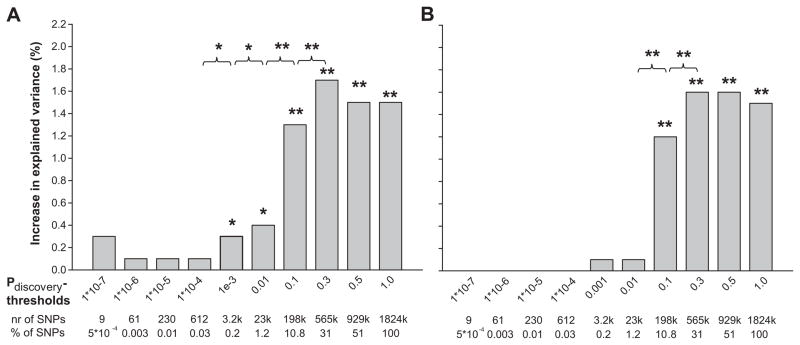
Figure 2. Increase in explained variance in diastolic blood pressure by genetic risk scores.
Bars represent the increase in explained variance (%) of diastolic blood pressure, when adding the genetic risk scores for different p-value thresholds, to the base line model for diastolic blood pressure including BMI, sex and age as covariates. The baseline model explained 8.4% and 1.4 % of the variance in diastolic blood pressure for adults and children respectively. We evaluated the difference in explained variance between two subsequent models by calculating the Akaike Information Criterion (AIC) of each model. The difference in AIC follows a χ2 distribution with one degree of freedom, from which the P-value was derived.
* p < 0.05
** p < 0.001
2a. Rotterdam Study III
2b. Generation R Study

