FIG. 4.


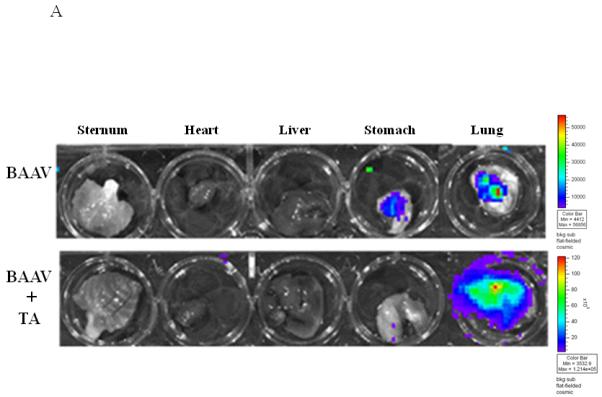
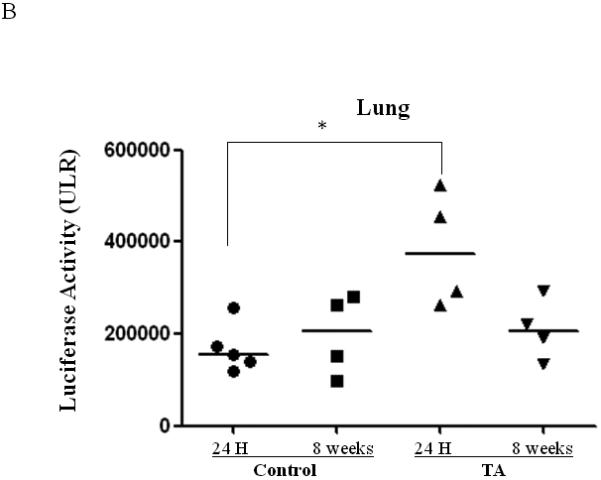
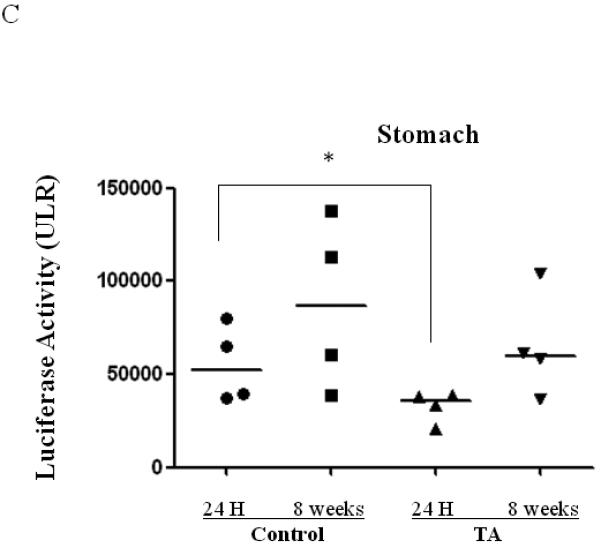
Biodistribution of i.n. administered BAAV–Luc. Four mice per group were injected with 200ul of PBS containing none or 3mg of TA prior to i.n. delivery of 5.109 DRP of BAAV-Luc. 24 hrs or 8 weeks post treatment respectively mice received luciferin substrate then were sacrificed and expression quantified. (A) Luciferase activity of representative mice receiving BAAV alone or BAAV+TA 24 hrs post transduction. (B and C) Average luciferase activity of whole lung or stomach respectively of mice receiving BAAV alone (control) or BAAV+TA (TA), 24 hrs or 8 weeks post treatment respectively. Medians represented by horizontal lines. Student’s t-test * P value <0.05.
